A connection circle shows how the parts of a situation push on each other. Students write parts round a circle, draw an arrow wherever one part changes another, and the tool finds the loops that keep the situation going. A tutor group might map why late-night phone use is hard to stop, or a Year 9 class might map what makes a group project fall behind.
Where your data goes
Your circle is kept in this browser as you work, so it is still there when you come back. Save keeps a copy under a name you choose. Saved copies are included in Backup & Restore, and in sync if you have turned it on. A share link holds the whole circle, so nothing is uploaded and nobody needs an account. If you clear the browser's data, you lose anything you have not backed up.
Quick start
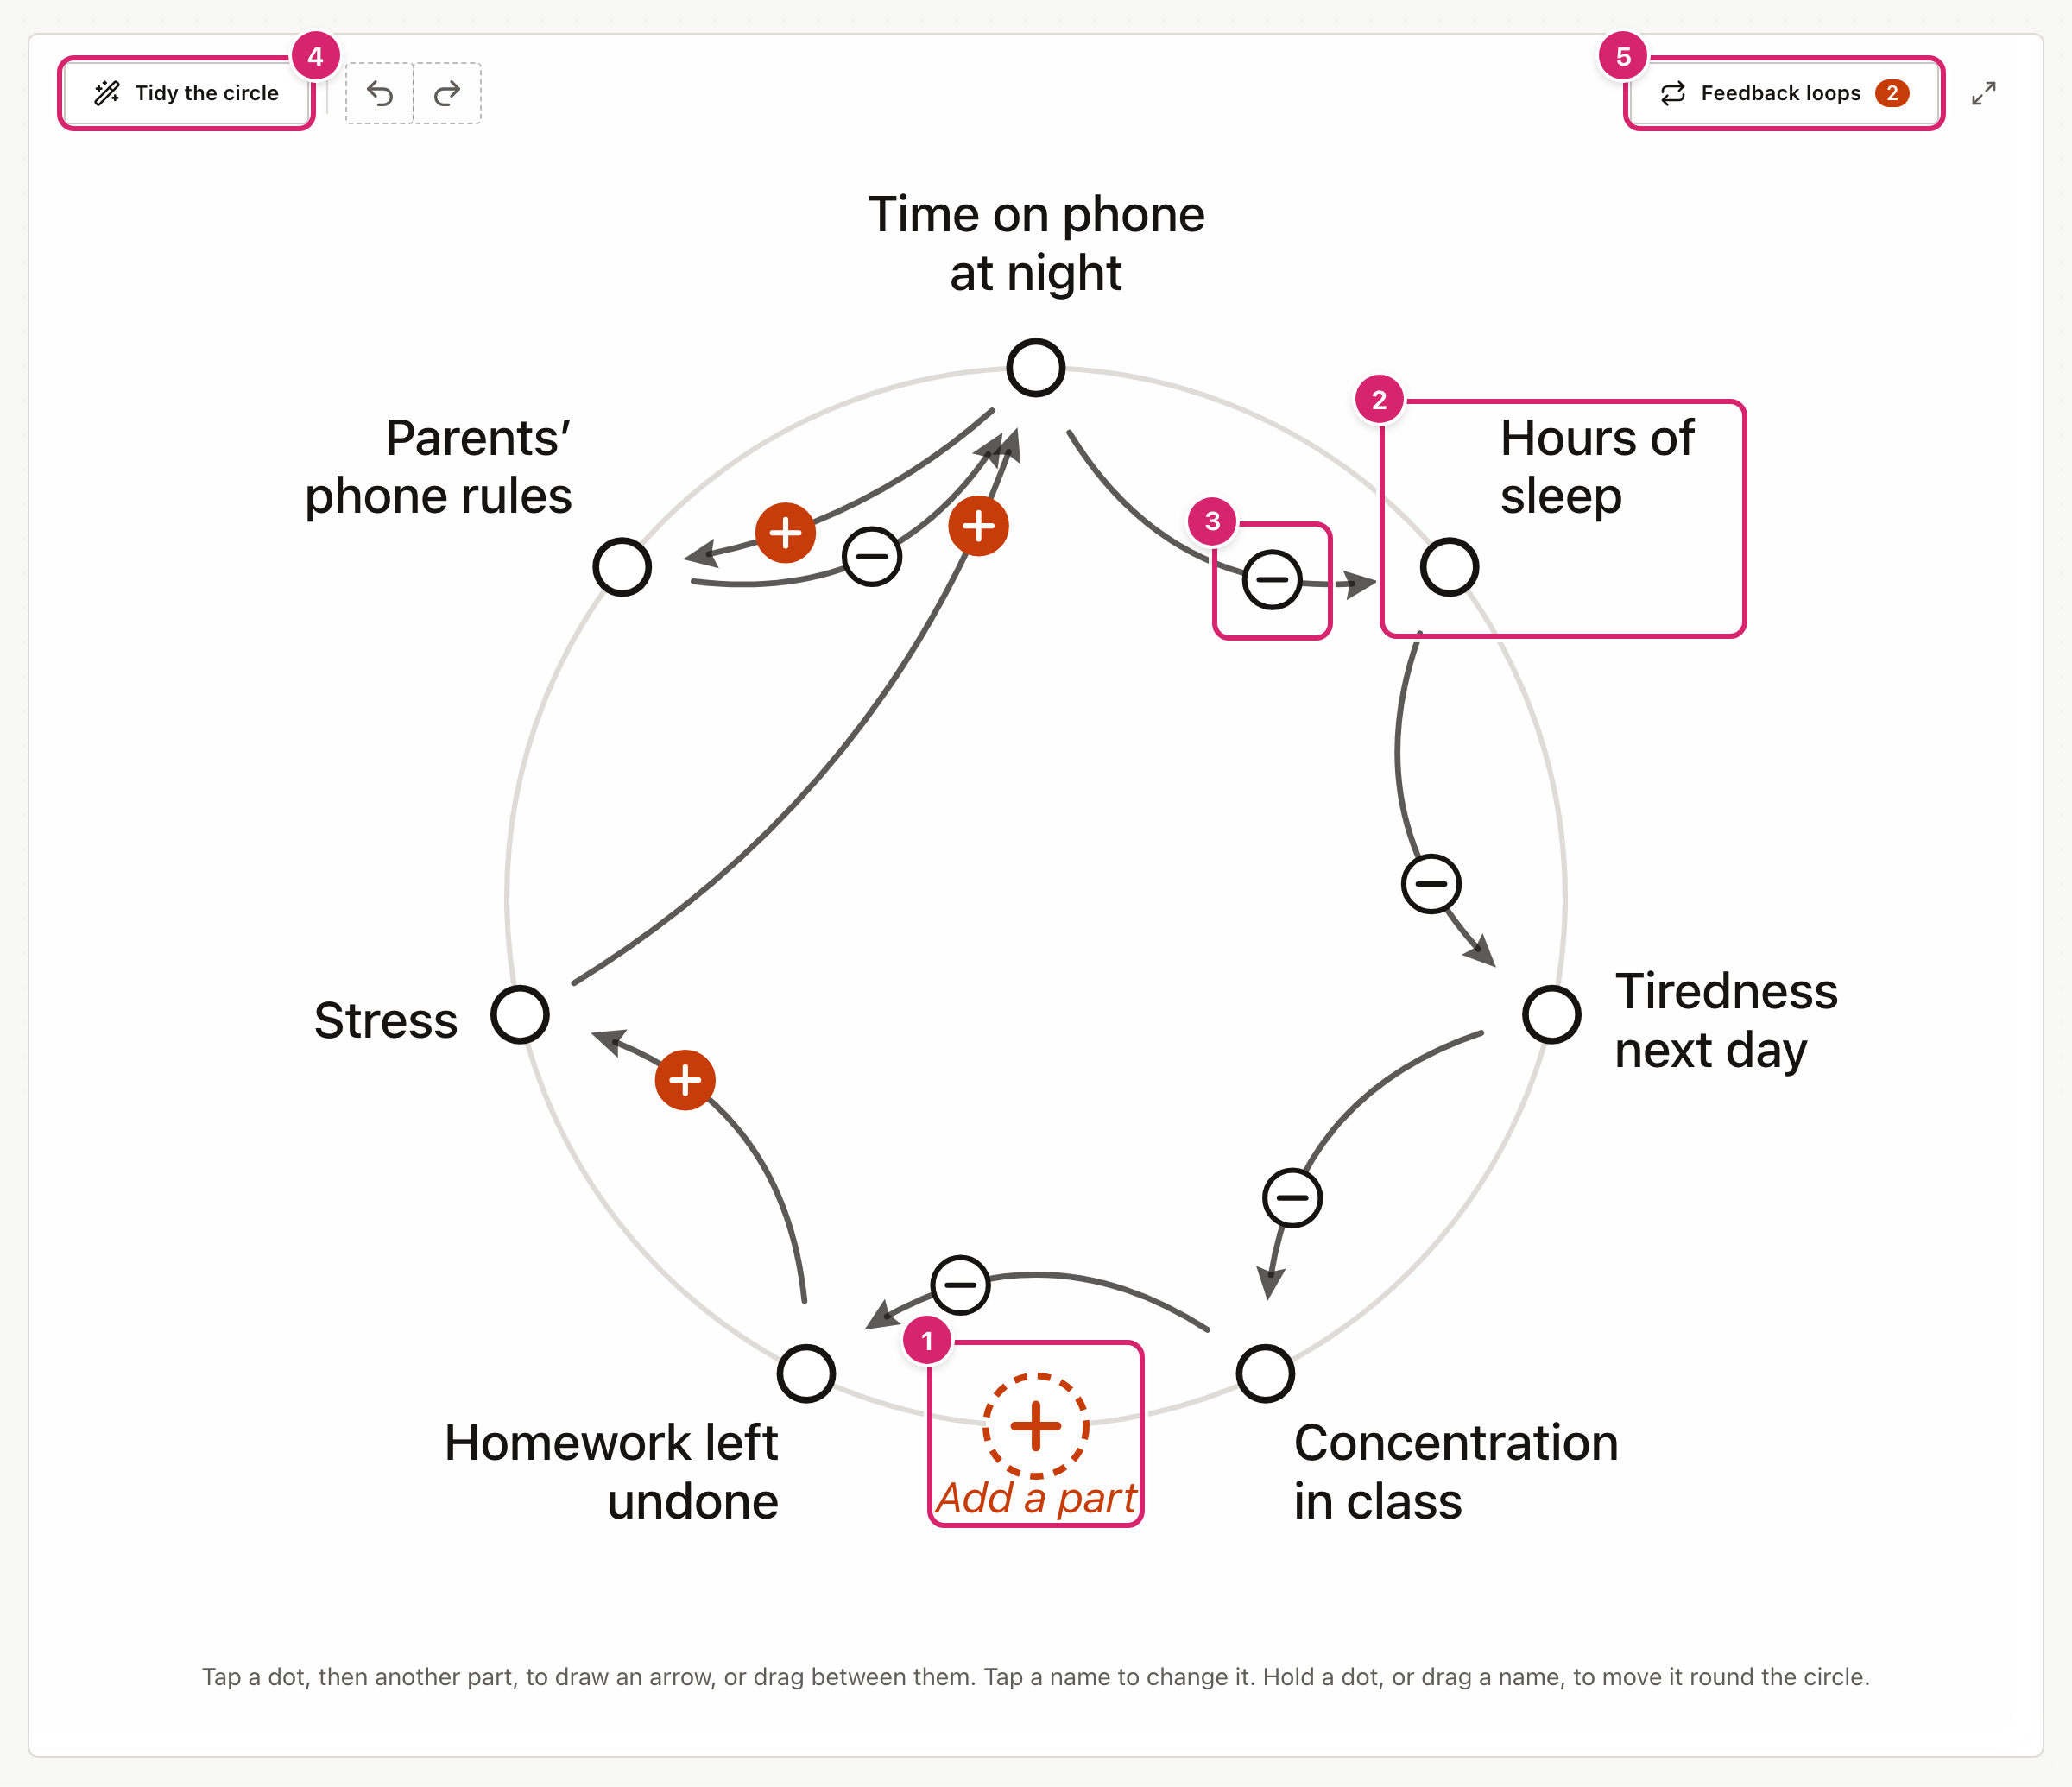
The tool opens on a worked example, "Phones at bedtime", so you can try everything before starting your own.
- Select the title or the question at the top of the page and type your own.
- Select the dashed Add a part spot on the circle 1 and type a part. Press Enter to add it and start the next one. Press Enter on an empty box to stop.
- Select a part's dot 2, then select the part it affects. An arrow appears, marked +.
- Select the sign on an arrow 3 to swap + and −.
- Select Tidy the circle 4 to space the parts out evenly.
- Select Feedback loops 5 to see the loops the tool has found. The number beside it says how many there are.
Start from an example
Open File and select Examples for 7 ready-made examples for ages 8 to 18, in tutor time, maths, science, geography, history, English and PE. They run from life in a pond to traffic in a town and order on the island in Lord of the Flies. Each one shows its age range and its question, and many add a note for teachers, such as the loops students should find. Select a subject to narrow the list, then Open to use one. It replaces what is on screen, and Undo brings your work back.
Add and arrange parts
A circle holds up to 12 parts, though five to eight is plenty. Good parts are things that can go up or down, such as "Hours of sleep".
With a mouse, a + follows the pointer round the circle, so you can add a part exactly where you want it. On an iPad, the + sits in the widest gap.
To move a part, drag its name round the circle, or press and hold its dot until a dashed ring appears and then drag. Its arrows follow. Tidy the circle appears once there are three parts. It spaces them evenly, in the order that crosses the fewest arrows.
Change a part
Select a part's name to open its toolbar 1. From left to right, the buttons move the part anticlockwise, move it clockwise, change its colour, rename it and remove it.
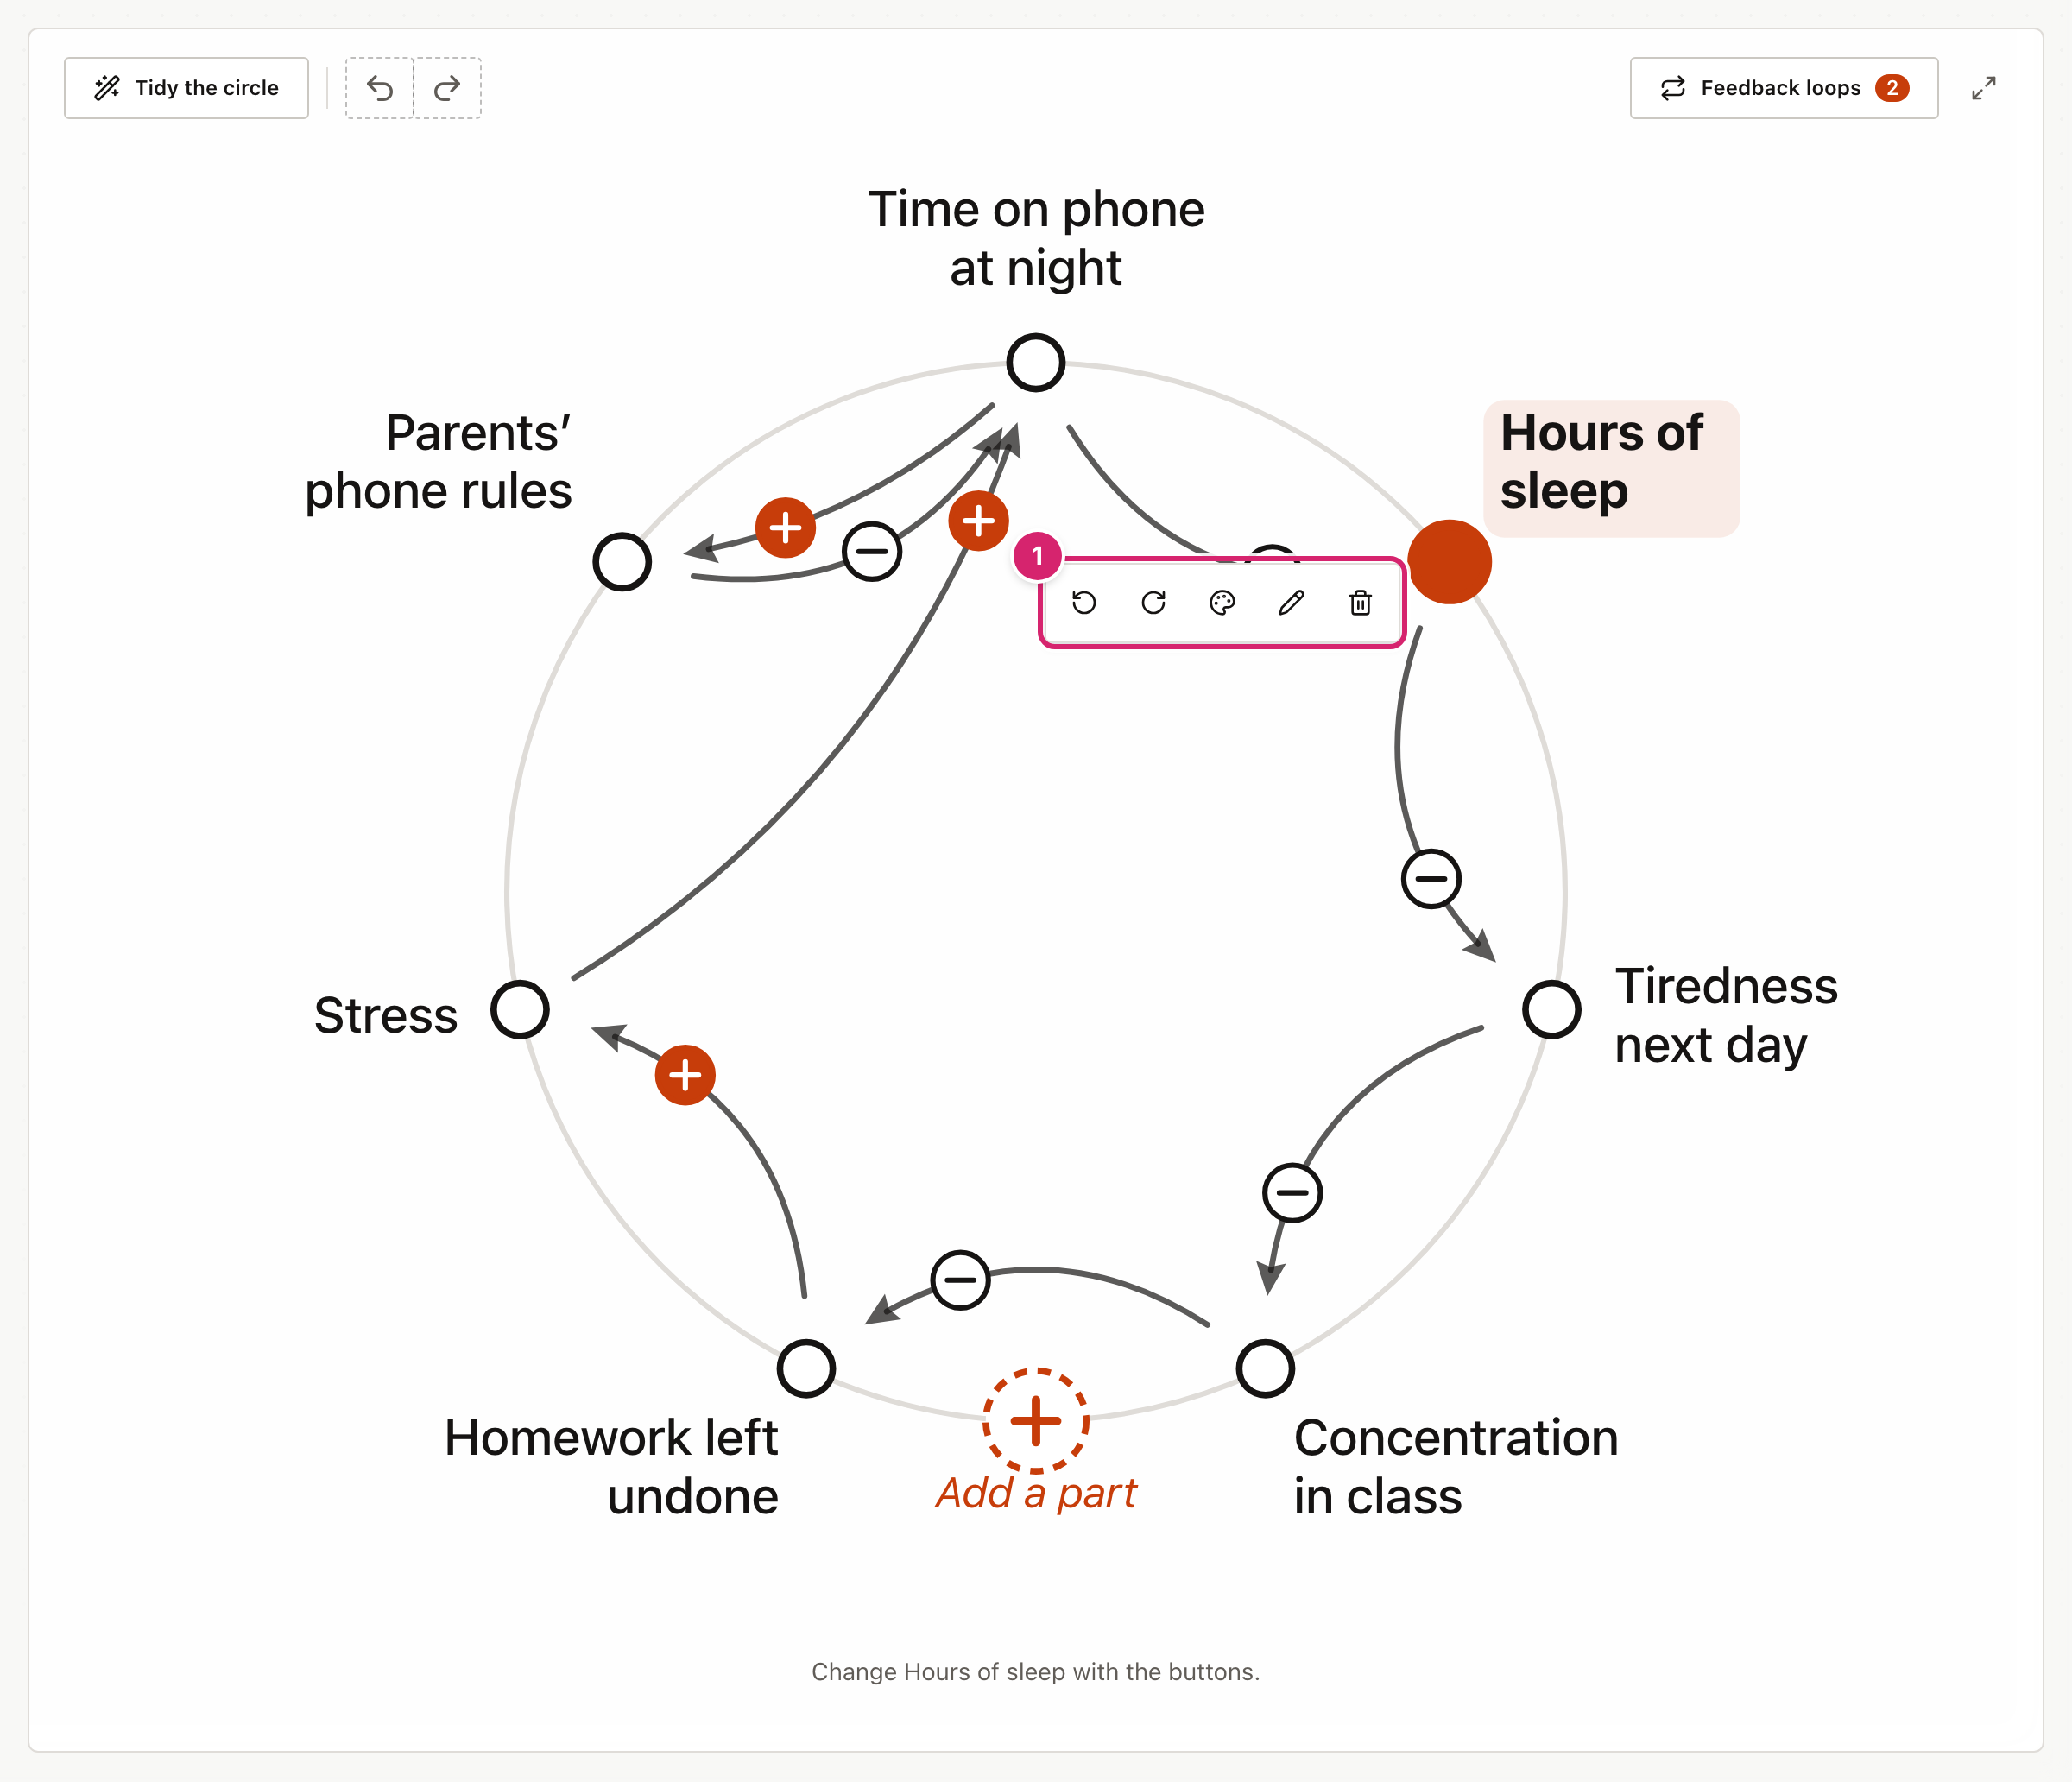
There are six colours, plus none. Use them to group ideas, such as home and school, or to show who wrote each part.
Draw arrows and read the loops
Select a part's dot and then the part it affects, or drag from the dot to that part. Select the dot again to stop without drawing. Each arrow has a sign:
- + means both parts move the same way. More time on the phone, more stress.
- − means they move opposite ways. More time on the phone, less sleep.
Each sign sits near its arrowhead. Where two arrows arrive at the same part, one sign sits further back along its arrow so they never overlap. Select a sign to swap it. Select the arrow itself for a toolbar. From left to right, it has + and −, a menu for how strong the link is, a button to turn the arrow round, and a button to remove it. A link can be Weak, Normal or Strong, drawn as a thinner or thicker arrow. Strength does not change which loops the tool finds. It shows which links matter most.
To see how many arrows touch each part, select Settings in the tool header and turn on Count each part’s arrows under Systems Thinking. Every part then shows a small count, such as "1 in · 3 out". Arrows in are what move the part. Arrows out are what it moves. A part with many arrows going out tends to drive the situation. A part with many arrows coming in is where you see the effects. This setting only changes your own screen, and share links do not include it.
Select Feedback loops, above the circle on the right, to list every loop. A loop is a path of arrows that comes back to where it started. The number on the button says how many there are. Each one is marked:
- R (reinforcing) has an even number of − arrows. It feeds itself, so the situation keeps growing or keeps shrinking.
- B (balancing) has an odd number of − arrows. It pushes back, so the situation settles.
Point at a loop in the list to light it up on the circle. Select it to keep it lit after the list closes, and select the cross beside the button to show everything again. Show this loop on its own hides everything else, which helps on a crowded circle.
Say what the colours mean
Once a part has a colour, a key appears under the circle. Select What does green mean? (or whichever colour) and type what it stands for, such as "People" or "Things we can change". The key travels with the link and the download, and a starter keeps any meanings you gave.
Carry it over to a causal loop diagram
When the circle shows a loop worth a closer look, open File and select Open as a causal loop diagram. The Causal Loop Diagrams tool opens with the same parts and arrows, placed where they sat on the circle. There you can drag them apart and mark delays. Whatever was on the causal loop page before is replaced, and Undo there brings it back.
Share, save and download
- Share makes a link. A starter for students locks your title, parts and arrows, and students add their own around them. An exact copy is for handing work back or sharing with a colleague.
- Save keeps a copy on this device under a name you choose. It reads Saved while the screen matches a saved copy. To find it again, open File and select Open a saved diagram. You can rename or delete saved copies there too, and deleting asks first.
- To download the drawing, open File and select Picture (PNG), for slides or Drawing (SVG), to edit or print large.
- Full screen is the button with two arrows in the top-right corner of the drawing. The tool then fills the screen, which suits the board. Press Esc, or select it again, to go back.
- Undo and Redo are the two curved arrows at the top left of the drawing. Undo takes back your last change, and Redo puts it back. A whole drag counts as one change, and so does a word typed in one go. With a keyboard, press Ctrl+Z (⌘Z on a Mac) to undo, and Ctrl+Y (⇧⌘Z) to redo. In a box you are typing in, those keys undo the typing instead.
- To start again, open File and select New blank diagram. It asks first. If you change your mind, select Undo.
Tips
- Start with the parts, not the arrows. Have the class agree the parts first, then argue about each arrow.
- Ask "if this goes up, what happens to that?" for every arrow. It settles + or − faster than any definition.
- Use a starter link for homework. Send the parts locked and ask students to add the arrows.
Troubleshooting
I removed something by mistake. Select Undo straight away, as many times as you need. It works back through every change since the page opened, including starting a new one.
I cannot add another part. A circle holds 12 parts. Remove one, or split the situation into two circles.
The arrow went the wrong way. Select the arrow and use the turn-round button. It is greyed out if there is already an arrow going the other way.
Feedback loops shows 0, or says "None yet". A loop needs arrows that lead all the way back to where they started. Check that every arrow points the way you meant.
I cannot change some parts. They came from your teacher's starter link and are locked. Add your own parts around them.
My circle has gone. It is kept in this browser only. Another browser or device will not have it unless you saved it and turned on sync, or restored a backup there.