A causal loop diagram shows what drives what. Students write a few things that can go up or down, join them with arrows, and the tool marks each loop as reinforcing (an engine) or balancing (a brake). A Year 8 PE class might map how practice, skill and confidence feed each other, and where tiredness puts the brakes on.
Where your data goes
Your diagram is kept in this browser as you work, so it is still there when you come back. Save keeps a copy under a name you choose. Saved copies are included in Backup & Restore, and in sync if you have turned it on. A share link holds the whole diagram, so nothing is uploaded and nobody needs an account. If you clear the browser's data, you lose anything you have not backed up.
Quick start
The tool opens on a worked example, "Practice and confidence", so you can try everything before starting your own.
- Select the title or the question at the top of the page and type your own.
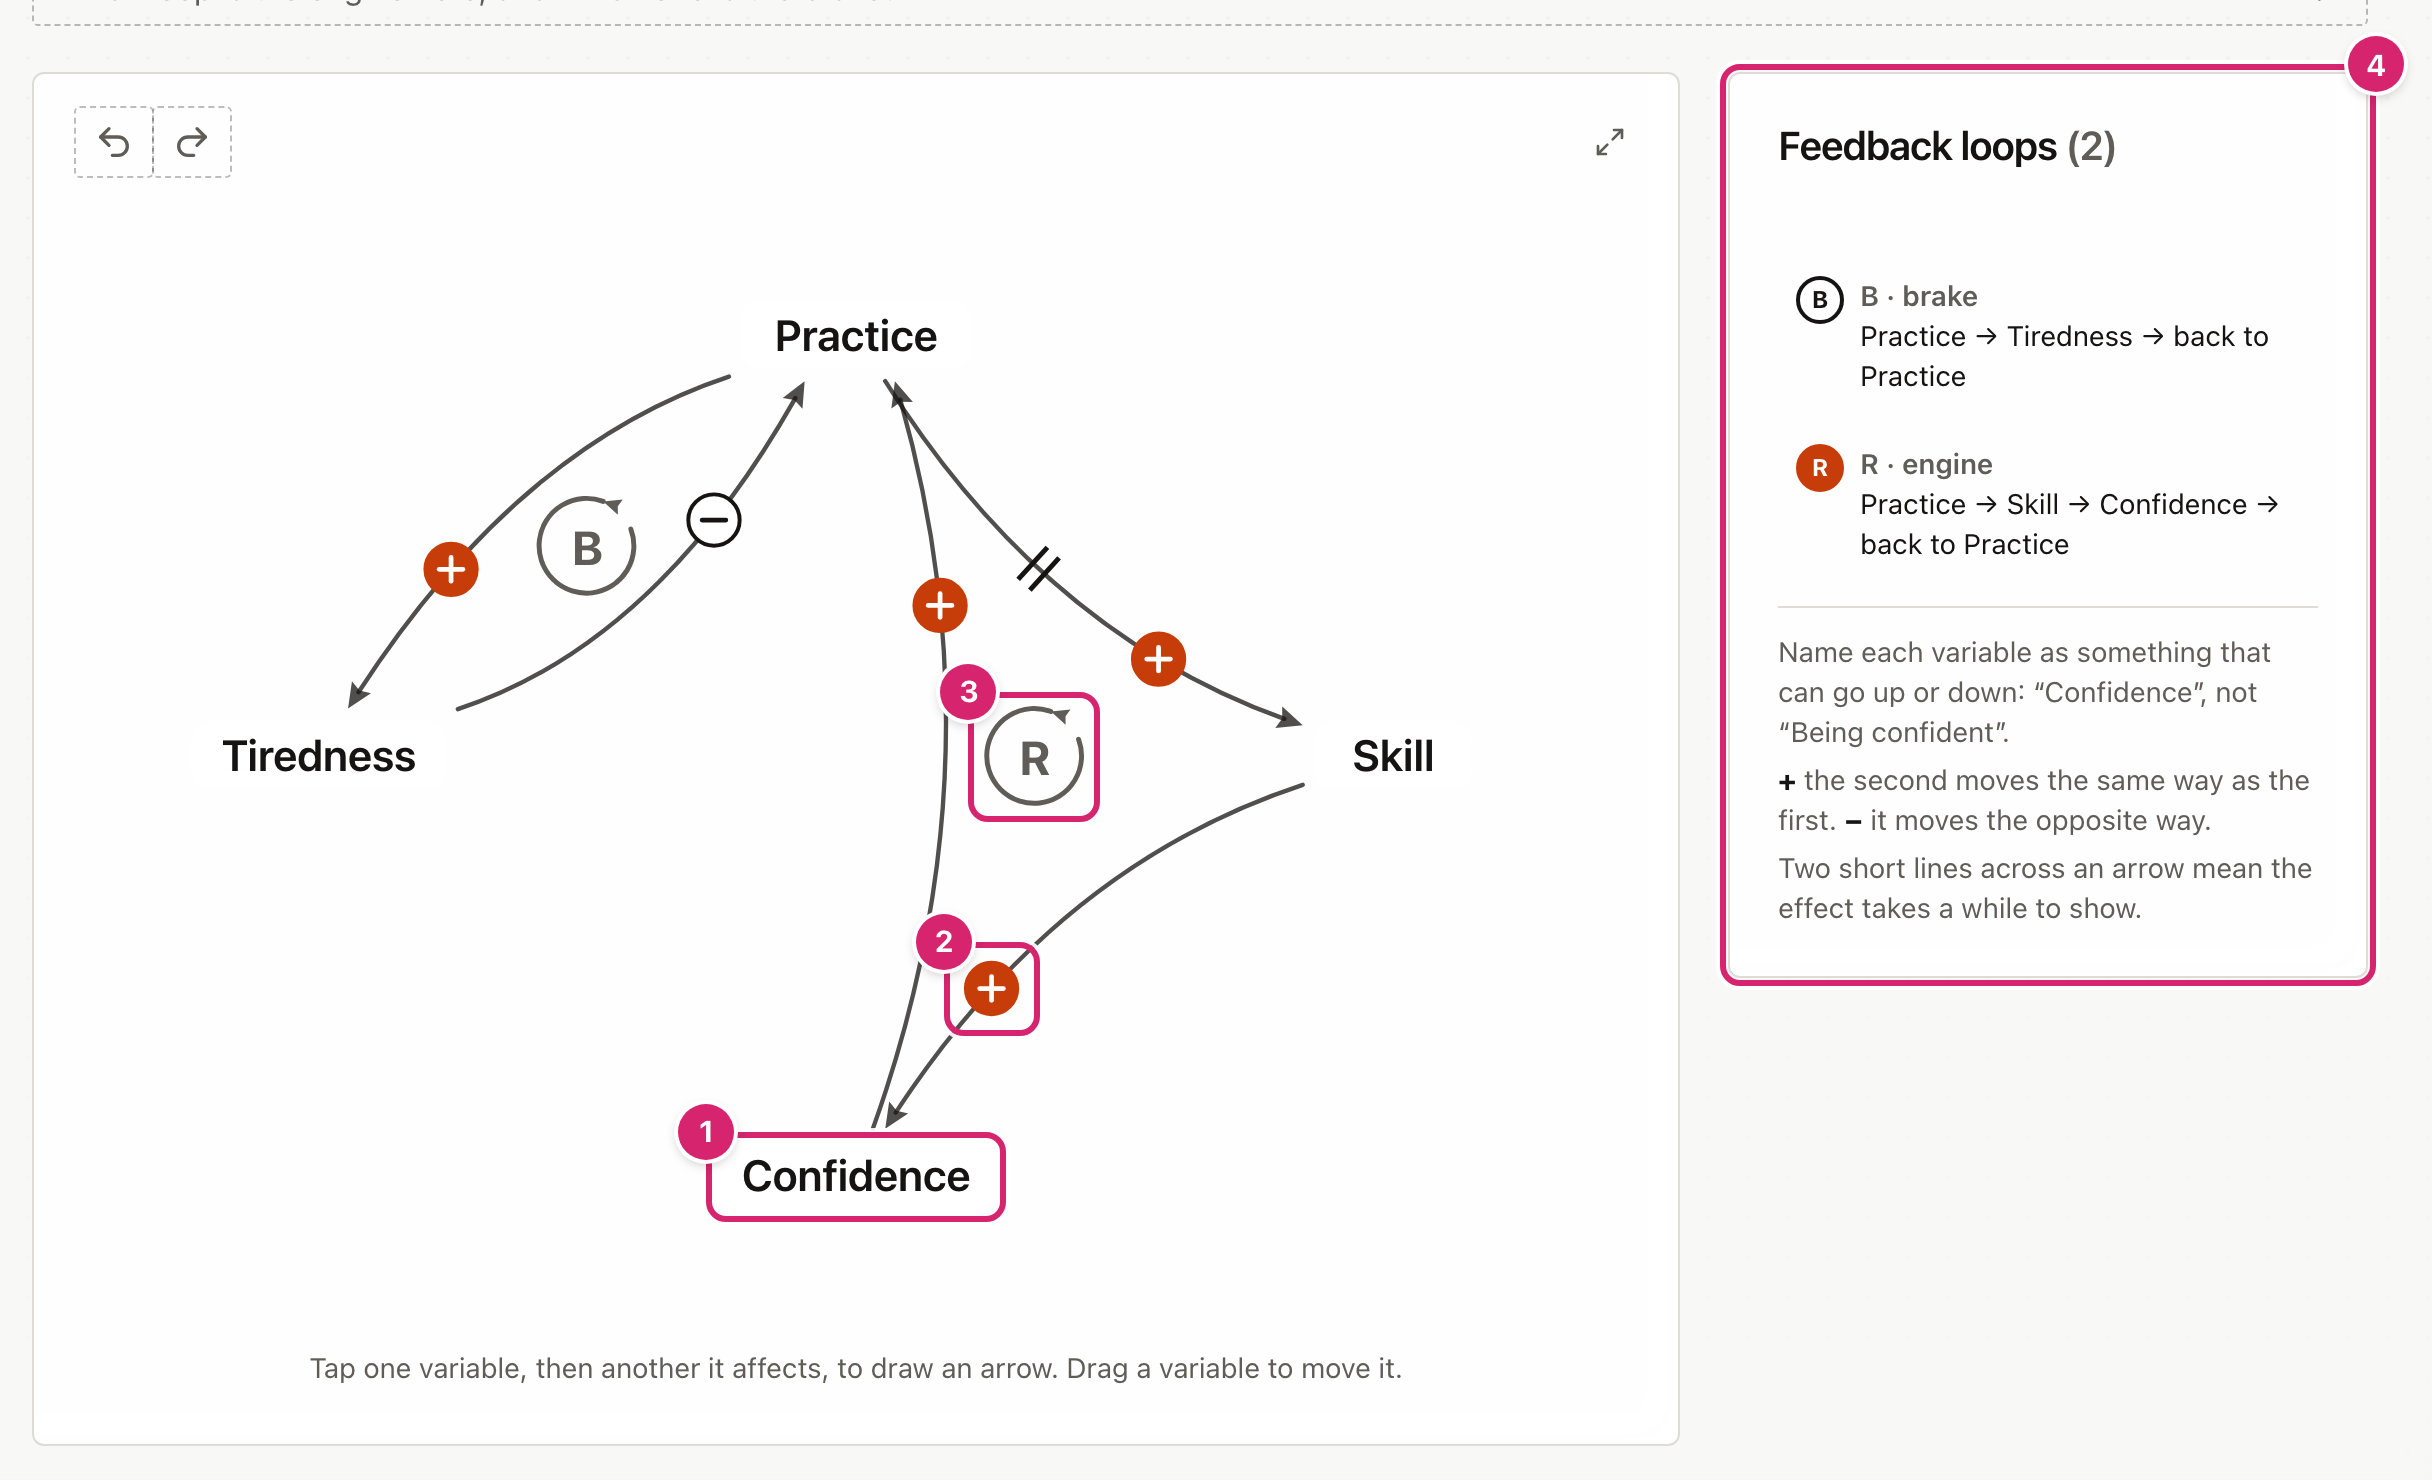
- Select an empty part of the page, type a variable and press Enter. A variable 1 is anything that can go up or down.
- Select one variable, then the variable it affects. An arrow appears between them.
- Select the sign near the arrow head 2 to swap + and −.
- When the arrows make a loop, an R or B marker 3 appears in the middle of it. Feedback loops 4 lists every loop.
Start from an example
Open File and select Examples for 9 ready-made examples for ages 8 to 18, in maths, science, geography, English, history, PE, economics, tutor time and computing. They run from rabbits and foxes to the naval arms race before the First World War. Each one shows its age range and its question, and many add a note for teachers, such as the loops students should find. Select a subject to narrow the list, then Open to use one. It replaces what is on screen, and Undo brings your work back.
Write good variables
A diagram holds up to 16 variables. Each one should be something that can go up or down. Write "Confidence", not "Feeling confident sometimes", and "Time spent revising", not "Revision". If students cannot say "more of it" or "less of it", the arrows will not make sense.
Drag a variable to move it. Select it to rename or remove it.
Draw and change arrows
Select one variable, then the one it affects. Each arrow has a sign:
- + means the second moves the same way as the first. More practice, more skill.
- − means it moves the opposite way. More tiredness, less practice.
Select the sign near the arrow head to swap it. Select the arrow itself to open its toolbar 1. From left to right: + and −, mark a delay, turn the arrow round, and remove it.
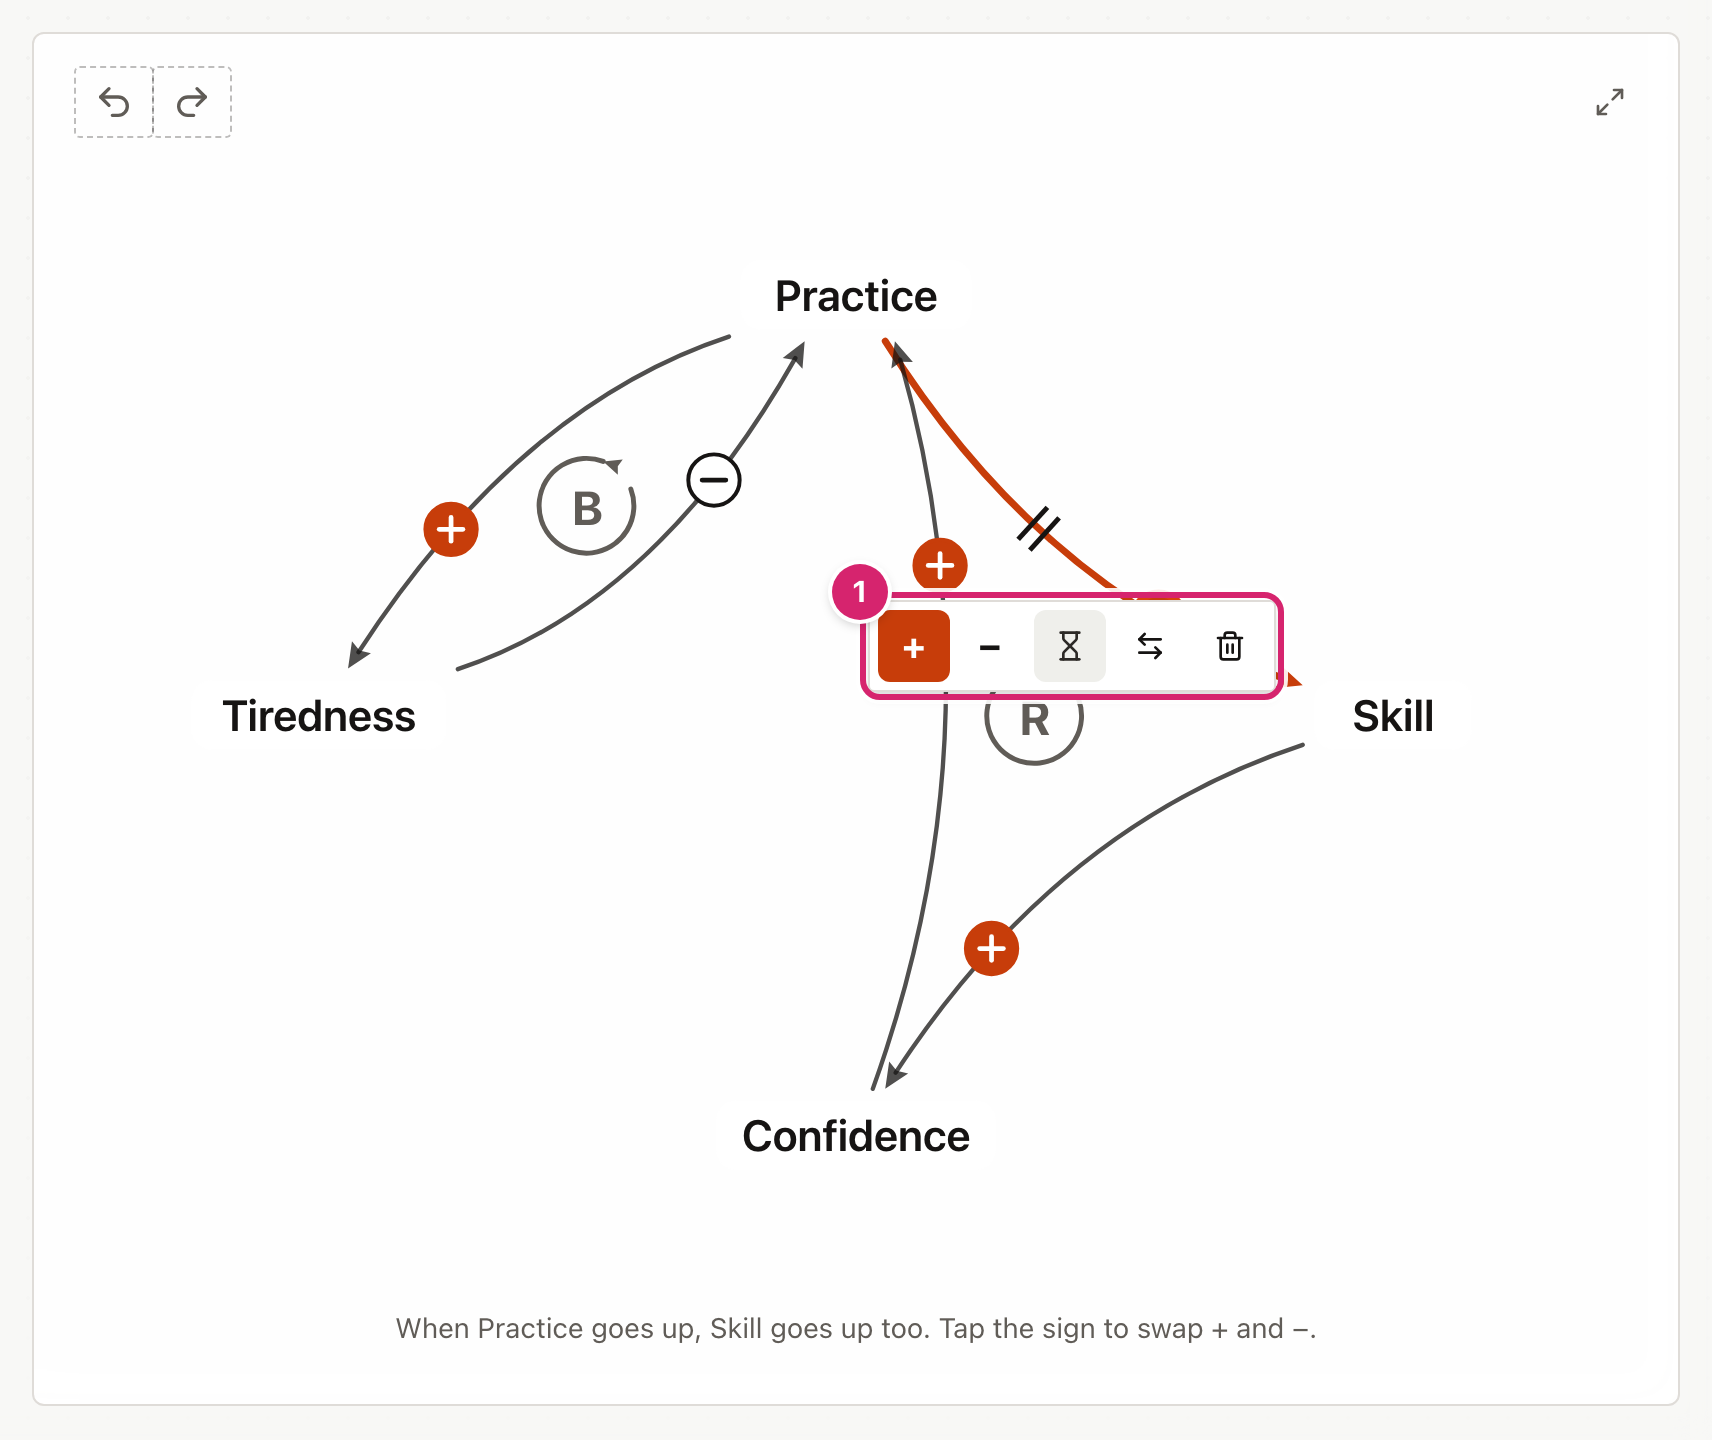
The hourglass marks a delay, for an effect that takes a while to show. A delayed arrow is drawn with two short lines across it. In the example, practice takes a while to turn into skill.
Read the loops
A loop is a path of arrows that comes back to where it started. The tool marks each one in the middle of the loop:
- R (reinforcing), the engine, feeds itself. Whatever is happening keeps growing, or keeps shrinking. It has an even number of − arrows.
- B (balancing), the brake, pushes back, so things settle. It has an odd number of − arrows.
The Feedback loops panel labels each loop "R · engine" or "B · brake". Select one to highlight it on the page. In the example, Practice, Skill and Confidence make an engine: more practice, more skill, more confidence, more practice. Practice and Tiredness make a brake: more practice, more tiredness, less practice.
When two arrows end at the same variable, their heads sit apart, so each sign stays next to its own arrow.
Share, save and download
- Share makes a link. A starter for students locks your title, variables and any arrows already drawn, and students add the rest. An exact copy is for handing work back or sharing with a colleague.
- Save keeps a copy on this device under a name you choose. It reads Saved while the screen matches a saved copy. To find it again, open File and select Open a saved diagram. You can rename or delete saved copies there too, and deleting asks first.
- To download the drawing, open File and select Picture (PNG), for slides or Drawing (SVG), to edit or print large.
- Full screen is the button with two arrows in the top-right corner of the drawing. The tool then fills the screen, which suits the board. Press Esc, or select it again, to go back.
- Undo and Redo are the two curved arrows at the top left of the drawing. Undo takes back your last change, and Redo puts it back. A whole drag counts as one change, and so does a word typed in one go. With a keyboard, press Ctrl+Z (⌘Z on a Mac) to undo, and Ctrl+Y (⇧⌘Z) to redo. In a box you are typing in, those keys undo the typing instead.
- To start again, open File and select New blank diagram. It asks first. If you change your mind, select Undo.
Tips
- Ask "engine or brake?" The worked example's question works for most diagrams: which loop drives the situation, and which one holds it back?
- Read each arrow aloud. "When practice goes up, skill goes up" catches wrong signs. When you select an arrow, the line under the diagram reads it out for you.
- Start from a connection circle. If students are new to loops, a connection circle is gentler. Move to this tool when they want to place things freely. In Connection Circles, File, Open as a causal loop diagram carries a circle straight over.
Troubleshooting
I removed something by mistake. Select Undo straight away, as many times as you need. It works back through every change since the page opened, including starting a new one.
Selecting the page does not add a variable. If a variable or arrow is selected, the first tap on the page only deselects it. Tap the page again to write. If that still does nothing, the diagram already has 16 variables. Remove one first.
There is no R or B marker. The arrows do not yet lead all the way back to where they started. Check that each arrow points the way you meant.
The turn-round button is greyed out. There is already an arrow going the other way between those two variables.
I cannot change some variables or arrows. They came from your teacher's starter link and are locked. Add your own around them.
My diagram has gone. It is kept in this browser only. Another browser or device will not have it unless you saved it and turned on sync, or restored a backup there.