A behaviour-over-time graph is a quick sketch of how something rose and fell. There are no numbers to plot. Students draw the shape with a finger, pen or mouse, then mark what happened at the turning points. A Year 10 tutor group might sketch their energy across a term and mark the mock exams, or a science class might compare a prediction with what really happened.
Where your data goes
Your graph is kept in this browser as you work, so it is still there when you come back. Save keeps a copy under a name you choose. Saved copies are included in Backup & Restore, and in sync if you have turned it on. A share link holds the whole graph, so nothing is uploaded and nobody needs an account. If you clear the browser's data, you lose anything you have not backed up.
Quick start
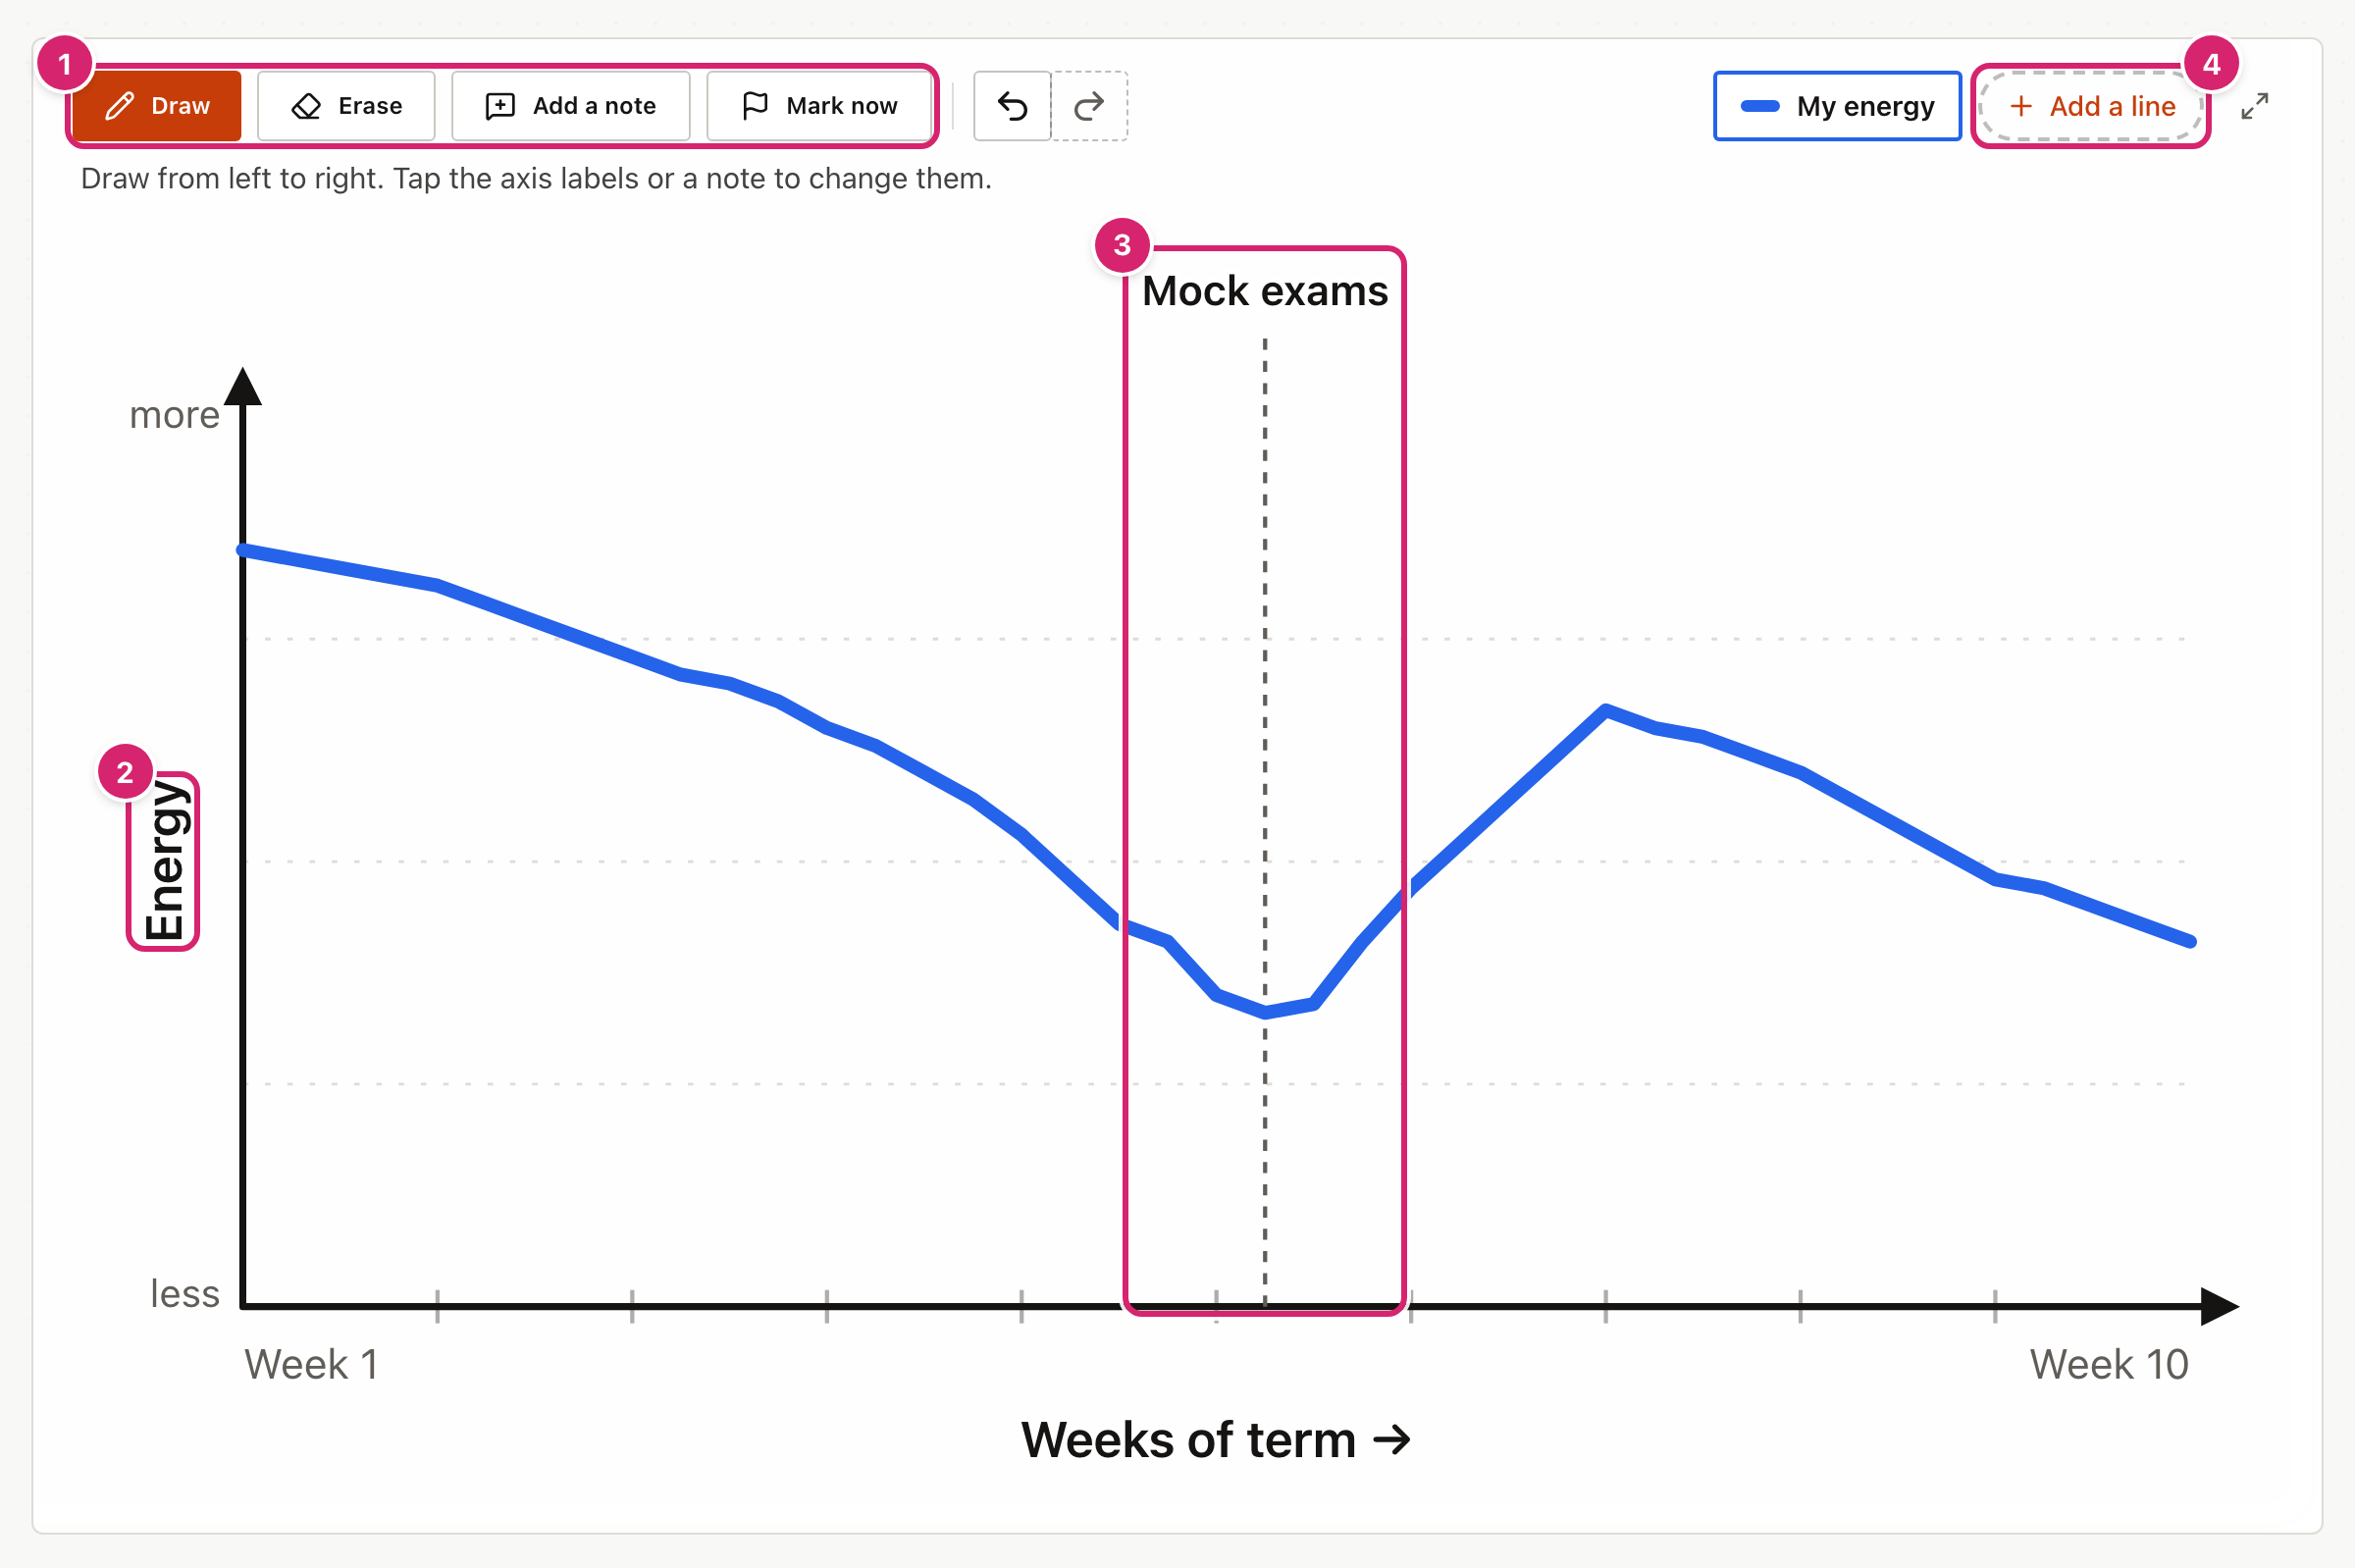
The tool opens on a worked example, "My energy this term", with one empty line ready to draw.
- Select the title or the question at the top of the page and type your own.
- Choose Draw 1 and draw across the graph from left to right.
- Select the side axis label 2 to say what is changing. Select the labels under the graph to say when time starts and ends.
- Choose Add a note and select the graph where something happened. Type the note 3 and press Enter.
- Select Add a line 4 if you want a second line to compare.
Start from an example
Open File and select Examples for 12 ready-made examples for ages 8 to 18, in tutor time, maths, English, history, science, geography, PE, economics, and music and drama. They run from a walk to school to guilt in Macbeth and hares and lynx in Canada, with lines already drawn and notes on the turning points. Each one shows its age range and its question, and many add a note for teachers, such as what to look for. Select a subject to narrow the list, then Open to use one. It replaces what is on screen, and Undo brings your work back.
Draw and correct a line
Draw from left to right. Going over part of the line again redraws that part, so there is no need to rub out first. Erase rubs out the part of the line you go over, leaving a gap.
The line has no scale on purpose. "More" and "less" are enough for students to talk about the shape: when it rose, when it dropped, and why. The light ticks along the bottom axis split the time into tenths. They have no numbers, but they help line moments up, such as "about halfway through term".
Label the axes
The axis labels are written on the graph. Select What is changing? on the side axis, the time label under the graph, or the start and end labels below the axis, then type and press Enter.
Mark what happened
- Choose Add a note. With a mouse, a dotted guide line follows the pointer to show where the note will go.
- Select the graph at the moment something happened.
- Type the note and press Enter. Press Escape to cancel.
Select a note on the graph to show its toolbar. From left to right, the buttons rewrite the note, give it a colour, and remove it. A coloured note's text and dashed line take that colour. Use colours to tell things apart, such as what happened at home and what happened at school. A graph holds up to 8 notes.
Mark "now" and sketch what might happen next
Select Mark now, then tap the graph at the present moment. A red line marked Now appears there. Everything drawn to its left is solid: what happened. Everything drawn to its right is dashed: what might happen next, hoped for or feared. Draw on past the line to sketch a future, or put two lines side by side to compare a hope and a fear. Tap somewhere else to move Now, or tap the line itself to take it away. Graphs without a Now line stay solid all the way across.
Compare lines
Each line has a chip above the graph, on the right, showing its colour and name. A graph holds up to 4 lines. Two lines on one graph work well for a prediction and what really happened, or for two people's view of the same term.
- Select a line's chip to draw on that line. The chosen line has a coloured outline.
- Select the chosen line's chip again to rename it, change its colour, clear its drawing or remove it. Clearing or removing a drawn line asks first.
- Add a line starts a new one.
Share, save and download
- Share makes a link. A starter for students locks the title, the axes, your notes and any line you drew. A line you named but left empty is for students to draw. An exact copy is for handing work back or sharing with a colleague.
- Save keeps a copy on this device under a name you choose. It reads Saved while the screen matches a saved copy. To find it again, open File and select Open a saved graph. You can rename or delete saved copies there too, and deleting asks first.
- To download the drawing, open File and select Picture (PNG), for slides or Drawing (SVG), to edit or print large. Downloads have a key under the graph naming each line.
- Full screen is the button with two arrows in the top-right corner of the drawing. The tool then fills the screen, which suits the board. Press Esc, or select it again, to go back.
- Undo and Redo are the two curved arrows beside Draw, Erase, Add a note and Mark now. Undo takes back your last change, and Redo puts it back. A whole drag counts as one change, and so does a word typed in one go. With a keyboard, press Ctrl+Z (⌘Z on a Mac) to undo, and Ctrl+Y (⇧⌘Z) to redo. In a box you are typing in, those keys undo the typing instead.
- To start again, open File and select New blank graph. It asks first. If you change your mind, select Undo.
Tips
- Predict, then compare. Draw a line called "What I expect" before a topic and an empty one called "What happened". Share it as a starter, and students fill in the second line later.
- Look ahead from "now". Mark Now partway along, then ask students to sketch what might happen next, once as a hope and once as a fear.
- Ask about the turning points. The interesting questions are at the peaks and dips: "What happened here?"
- Draw with a finger on an iPad. It is faster than a mouse and the shape comes out more natural.
Troubleshooting
I removed something by mistake. Select Undo straight away, as many times as you need. It works back through every change since the page opened, including starting a new one.
Nothing happens when I draw. Check that Draw is chosen, not Erase, Add a note or Mark now. If the graph says the line is your teacher's, pick or add a line of your own.
Add a note is greyed out. The graph already has 8 notes. Select one and remove it with the bin button first.
I cannot change the labels. They came from your teacher's starter link and are locked.
My graph has gone. It is kept in this browser only. Another browser or device will not have it unless you saved it and turned on sync, or restored a backup there.